|
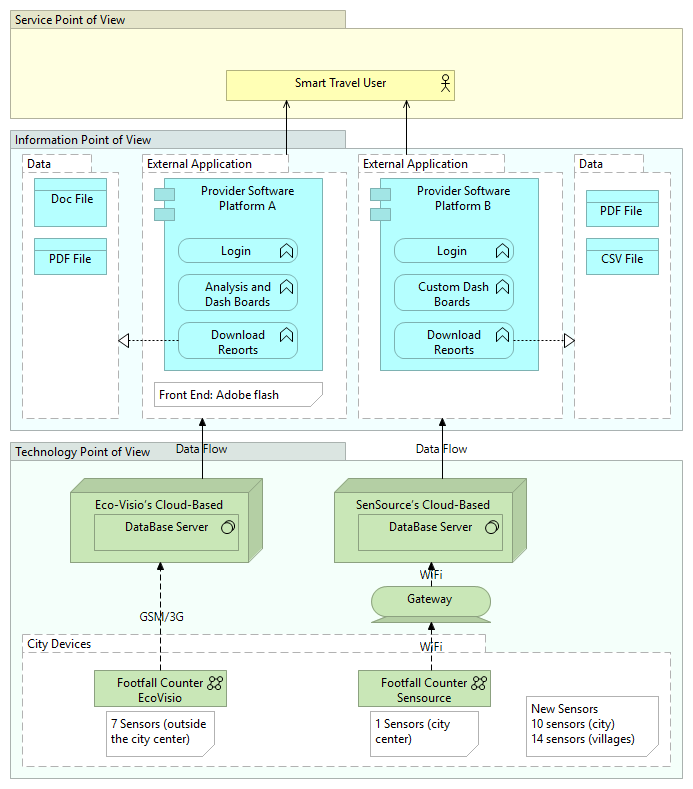
A conceptual example of a layered Enterprise Architecture description is presented as the first indication of the evaluation of the current state of a footfall counter service. The footfall counter service represents a city service which aims to collect the number of people in various places of a city in order to improve the environments of the city. |
 |
Modeled Architecture
In this very simple conceptual example, we are going to model the right-side of the architecture shown in the figure above. Specifically, we are interested in the
 |
Simulation Results
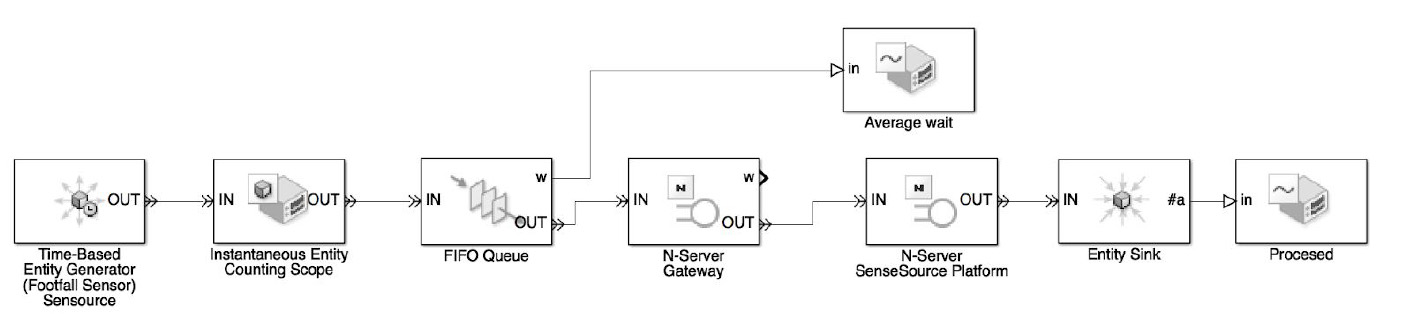
In this very simple conceptual example, we are going to model the right-side of the architecture shown in the figure above. Specifically, we are interested in the effect of processing power of the “Gateway” on the overall latency of the system (measured by the number of entities reached the final destination).
For demonstration purposes, we will show here two different results based on two different values of the “number of servers” property of “N-Server Gateway”. We are going to run the simulation for 100 time units, which is going to be represented as the x axe in the following figures.
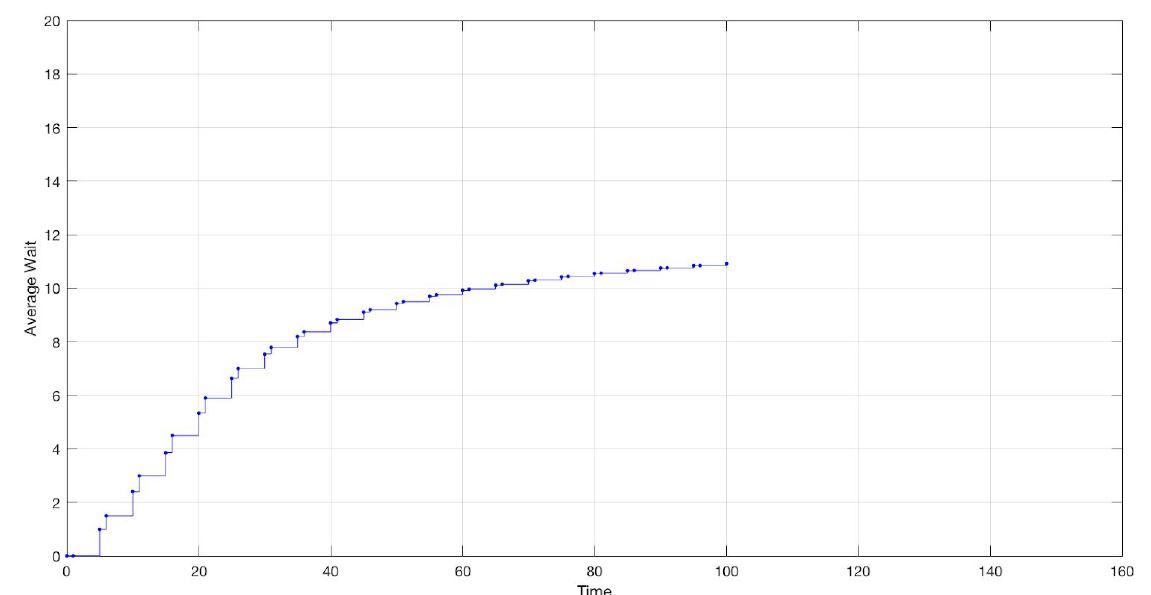
First Run (number of servers = 2)
 |
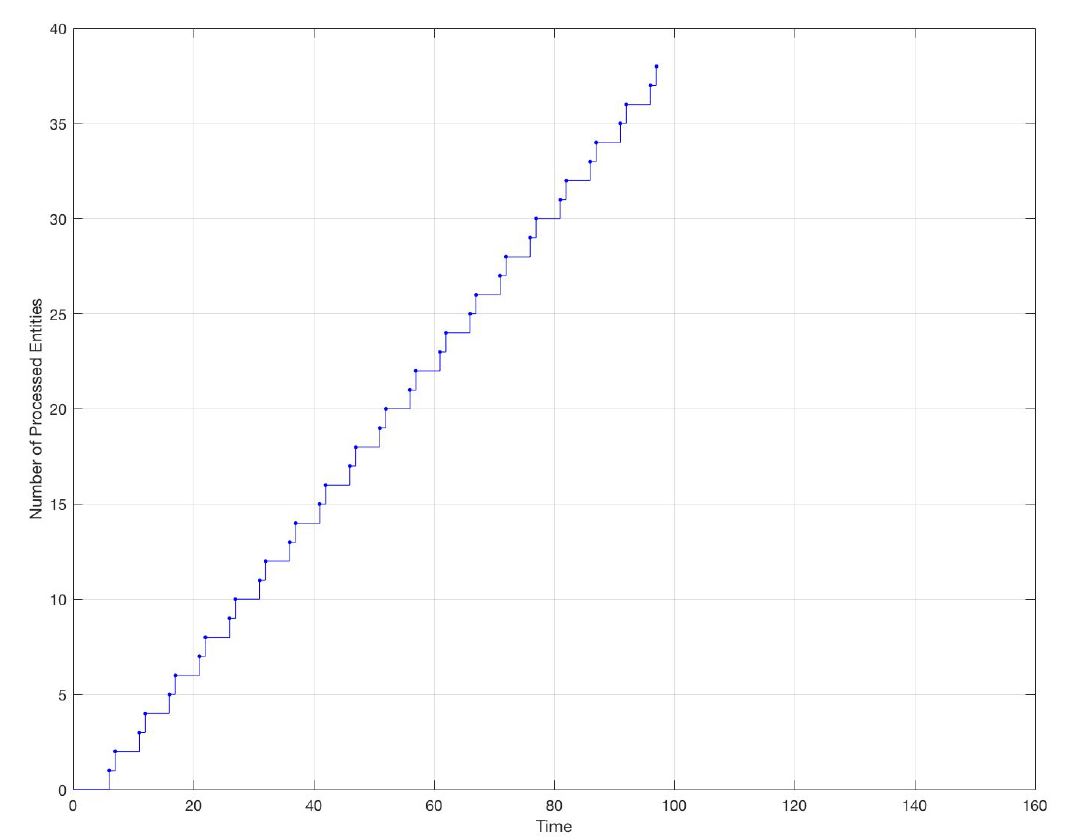 |
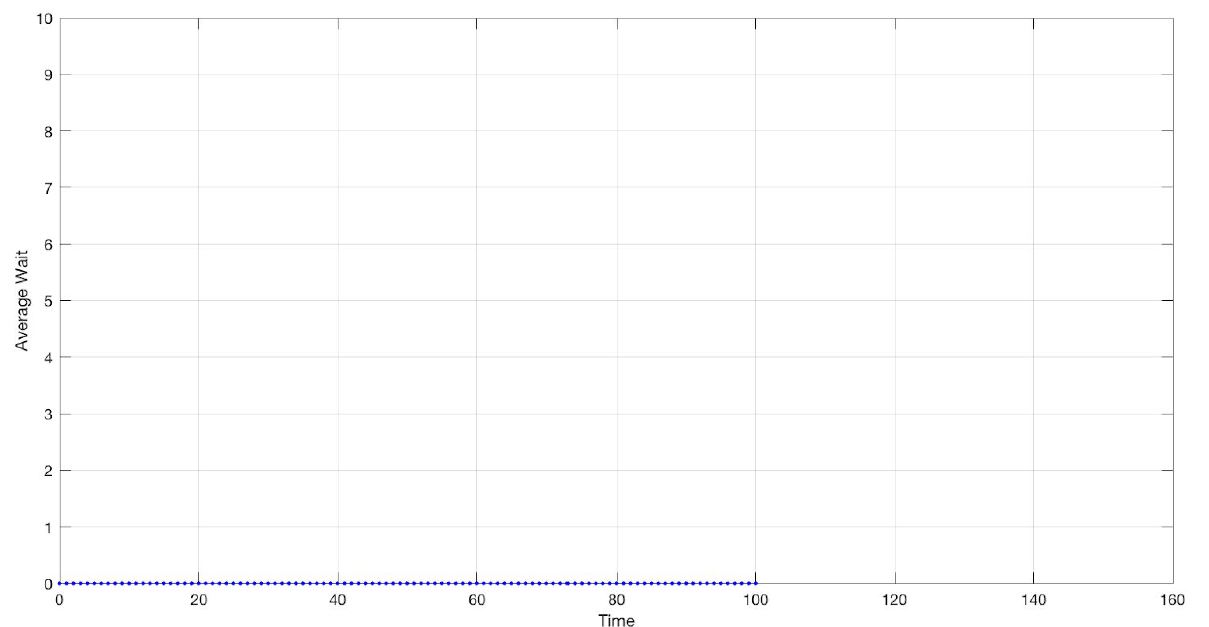
| Average time of entities waiting in the queue to be processed | Number of processed entities reached the final destination |
Second Run (number of servers = 5)
 |
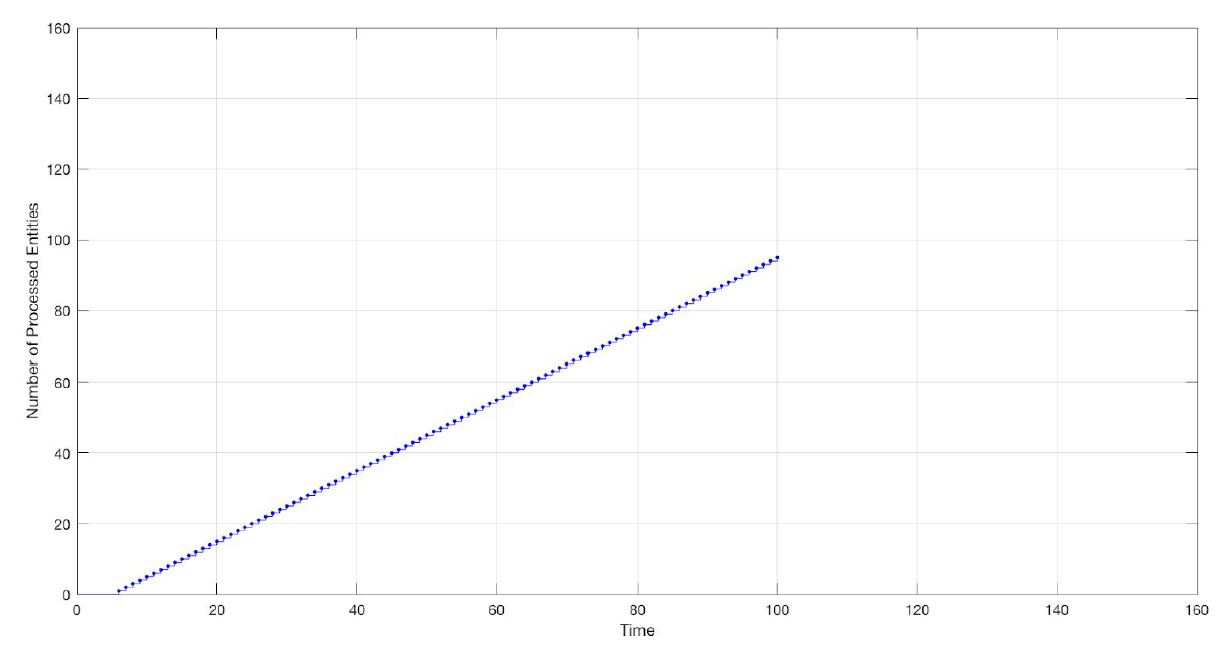 |
| Average time of entities waiting in the queue to be processed | Number of processed entities reached the final destination |
Analysis of the Results
As we can see, when we increased the processing power of the “Gateway” (by increasing the number of servers from 2 to 5), we achieved a waiting time of almost zero. In addition, the final number of entities reached the final destination are now linear with the time. This is just a very simple example to demonstrate how simulation can be used to evaluate architectures, specifically the dynamic properties and behavior. This example was just to show how Simulink can be leveraged for dynamic evaluation of architectures.